Projects
A selection of my work
UNDMSPC 3D Visualization Editor
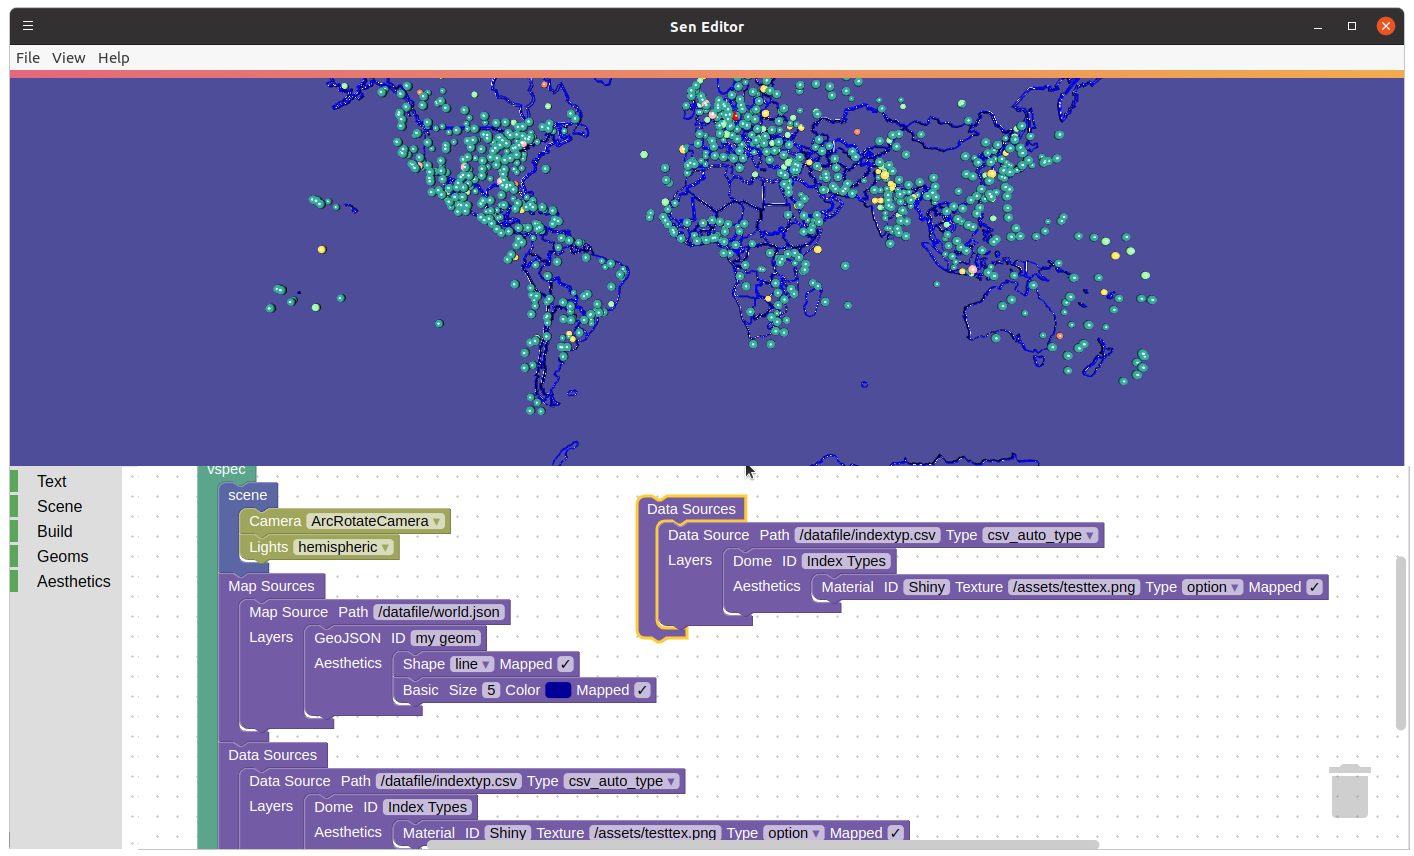
Most recently, I teamed back up again with the UNDMSPC to explore frameworks which would allow easy generation of 3D visualizations for non-techical audiences. We chose React, Electron, BabylonJS, and Google Blocks to prototype an extensible scene based visualization generator with amazing potential.
UNDMSPC Visualizations
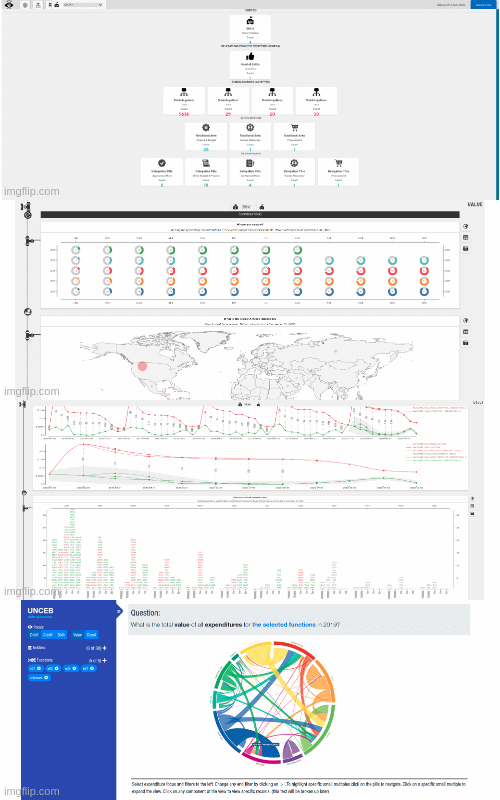
While working for the UN, I worked individually and in teams to create several bespoke visualizations which could provide vital funding information at a glance for our department and others like the UNCEB (Cheif Executives Board for Coordination).
UNDMSPC Analysis Toolkits
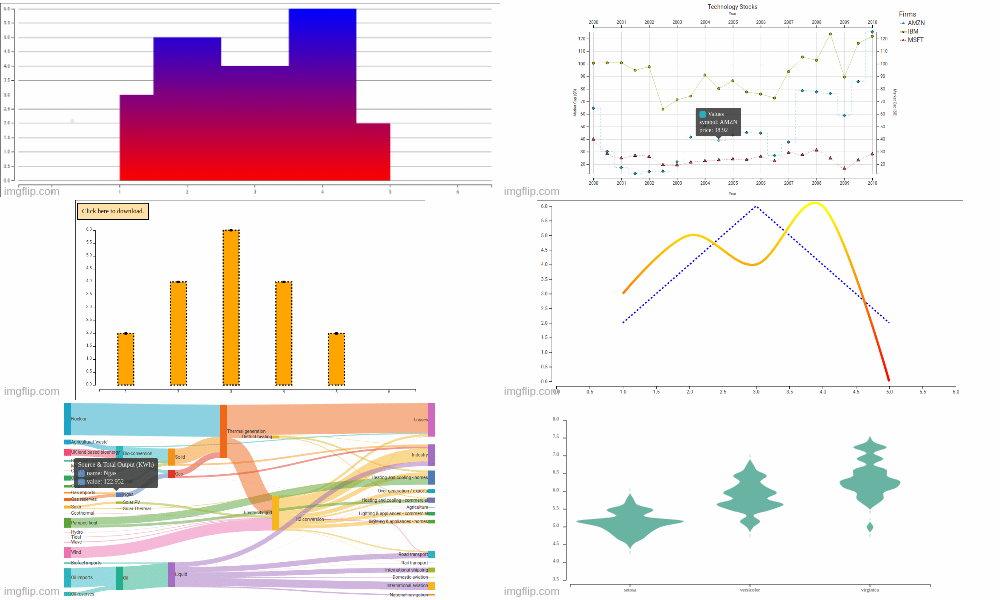
Often my team's unique insights required unique toolkits which didn't exist anywhere else. In the first several months of working at the UN, I focused on contributing to the "Harvest" project. Harvest was much more than a visualization API. Rendering charts and graphs to a canvas, Harvest could handle huge datasets and included wrangling, statistical, and even rudimentary machine learning libararies.
When it became clear that a paralell approach was needed to focus on next-gen functionality. I created a totally new visualization engine that improved flexibility while allowing more seasoned developers to customize and tune layout for any project's needs.
- Supports a wide variety of chart / graph types
- HTML flex-like templating worker for unlimited layout options
- Full text handling
- Responsive
- Color schemes
- SVG exporting
- Mixed chart types
- GGPlot2 style facets
- Hybrid svg / canvas charts
- Several graph force algorithms
- Data loading, wrangling, naming
- Extensible draw object plugin system
- Rendering using svg, paperjs, threejs
- Popups (Including cross graph popups)
- Mouseover change: color, opacity, scale
- Includes: basic templates, basic wranglers
- Supports: scales-accessors, gradients, rotation, all d3 axes, guides/legends
The engine could be used directly but also supported a ggplot style interface for researchers and statisticians. The layout system leveraged Facebook's headless DOM which I ran across multiple workers allowing for fantastic speedups on visualization heavy pages.
Justice Project Pakistan Torture Victim Intake
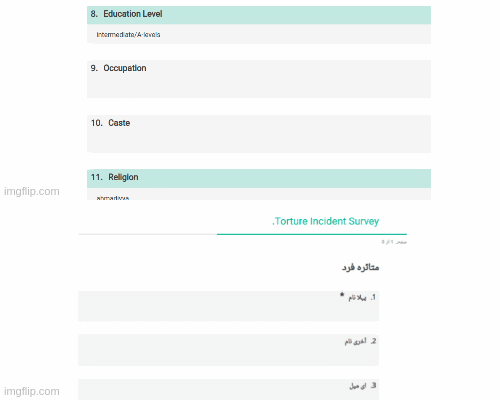
Justice Project Pakistan's team of lawyers needed to formalize their victim-intake process to make sure they get the help they need. Additionally, they wanted to start assembling a corpus of incident data against which they could generate supporting analytics for fundrasing and lobbying.
My bilingual intake questionaire supports multiple levels of trust and leverages AWS to support a rich Web API and granular administration.
It is currently seeking funding to roll out across several state agencies.
Justice Project Pakistan Torture Victim Visualation
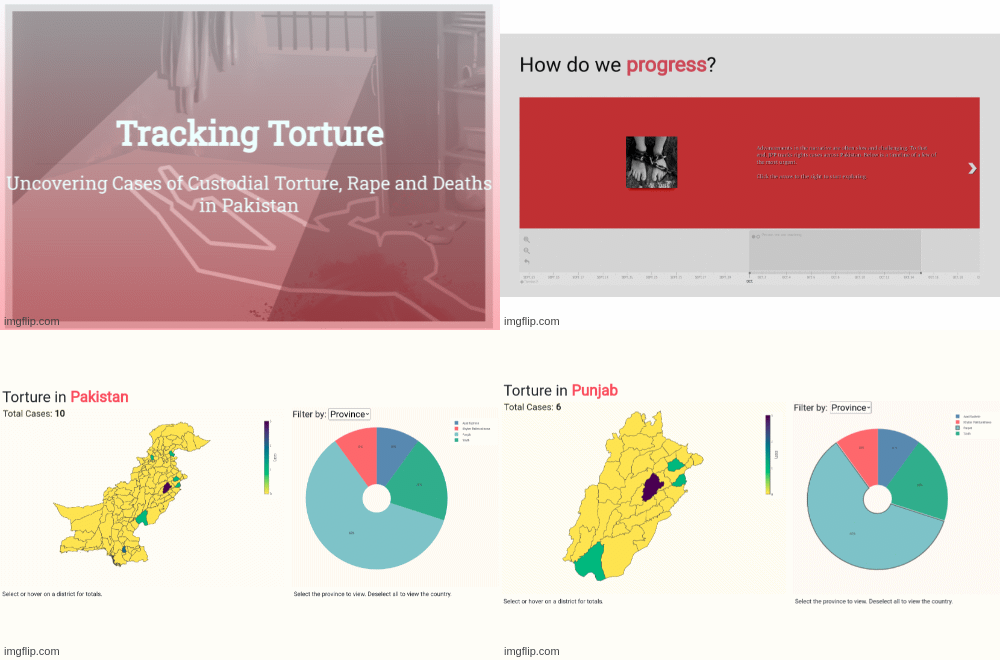
The first project to make use of the victim intake data, the visualization includes a simple responsive narrative to support advocacy and fund-raising efforts.
UN DataPeers Talk
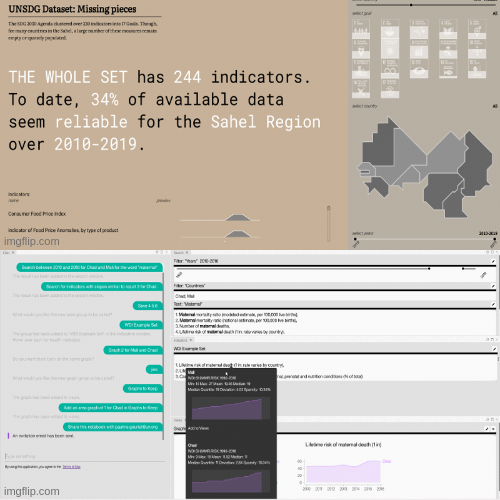
In a presentation I gave at a UN DataPeers session, I was able to build upon the interest in my Sahel work and deliver new specialized visualizations focusing on SDG dataset sparsity. Additionally, I showed an alpha prototype of a data notebook using IBM#s Watson plain language interface.
Masters Work: Sahel
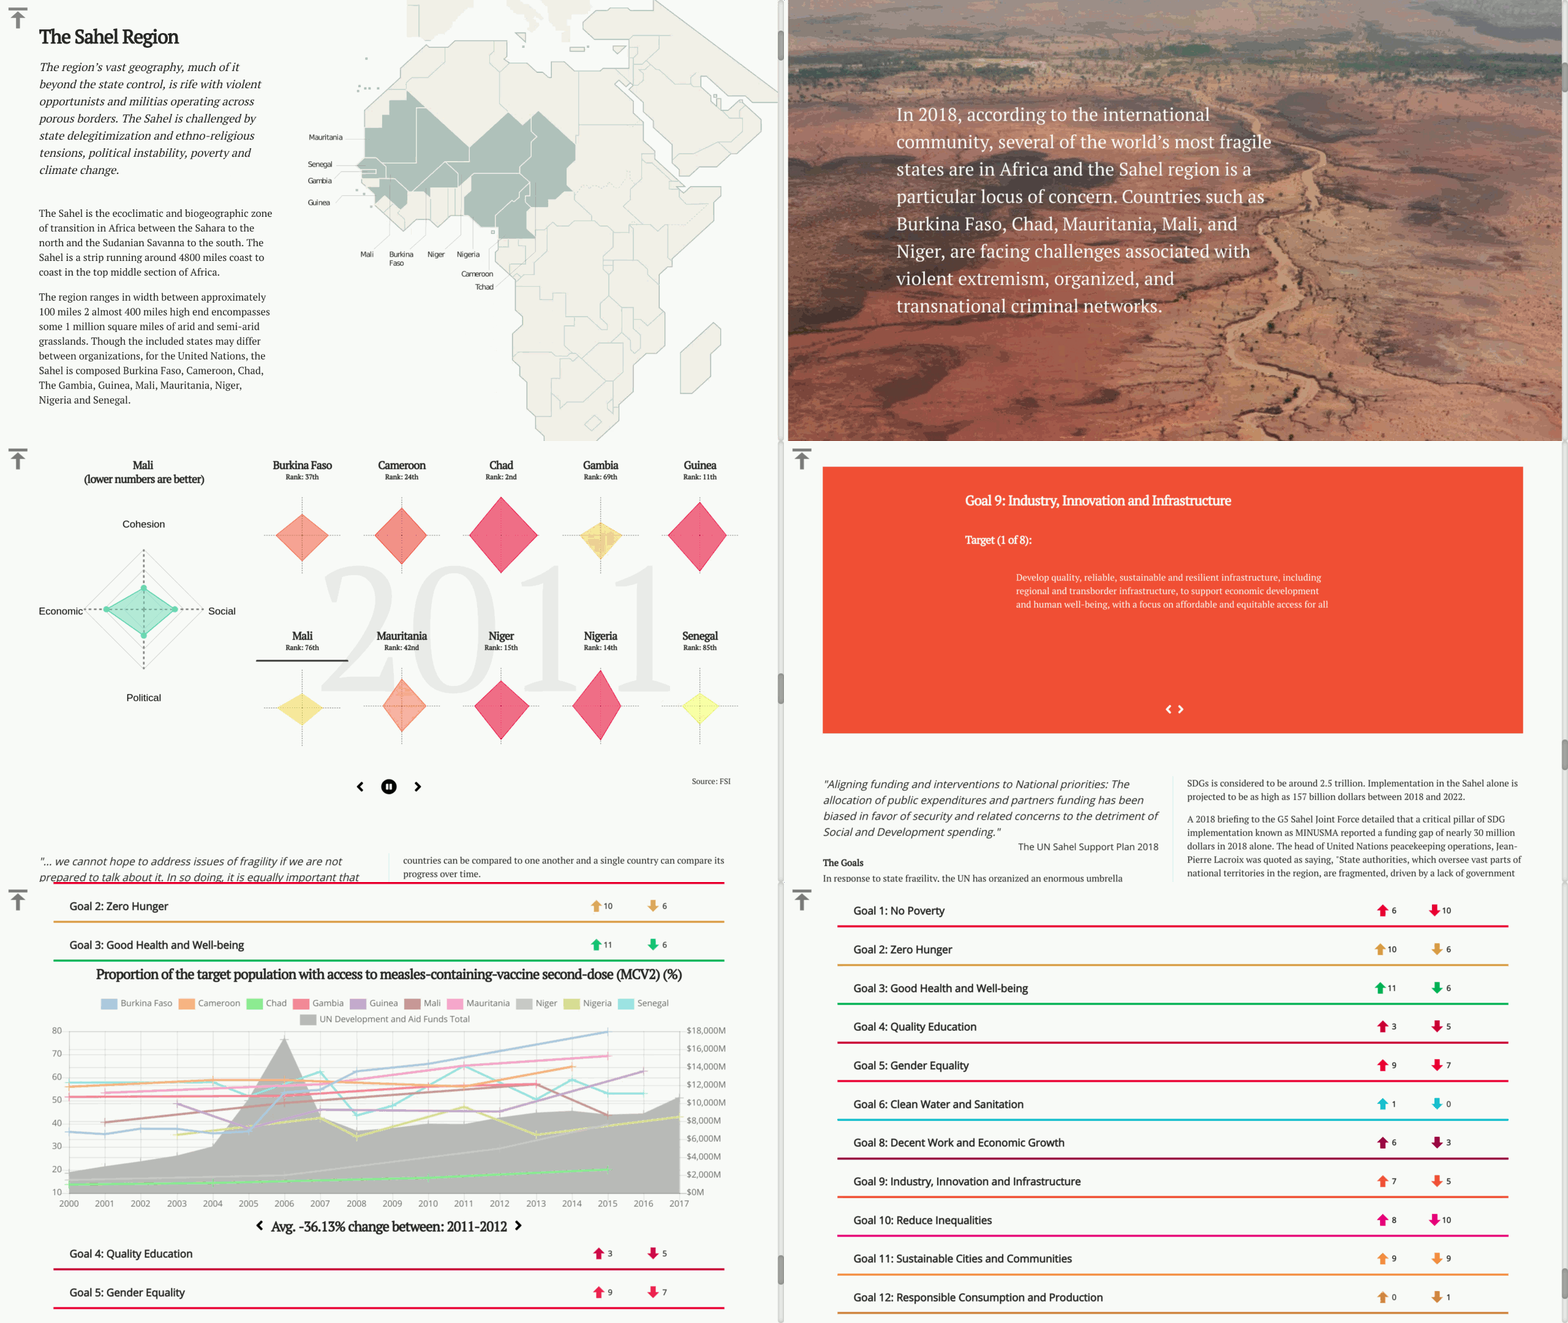
In what ways will the turmoil in the Sahel affect all of us? What is state fragility? How does the UN measure it? What initiatives have they created as a response to these challenges? Can they measure their progress effectively?
SciPy Jupyter Notebooks and other Masters work

This is a link to smaller projects I did during my degree program at Parsons the New School.
